Max Pain·Fair Value·Gamma Flip·GEX
Backtests of options strategies on real data, under today's market conditions.
See the positioning. Build the strategy. Measure it against the past.
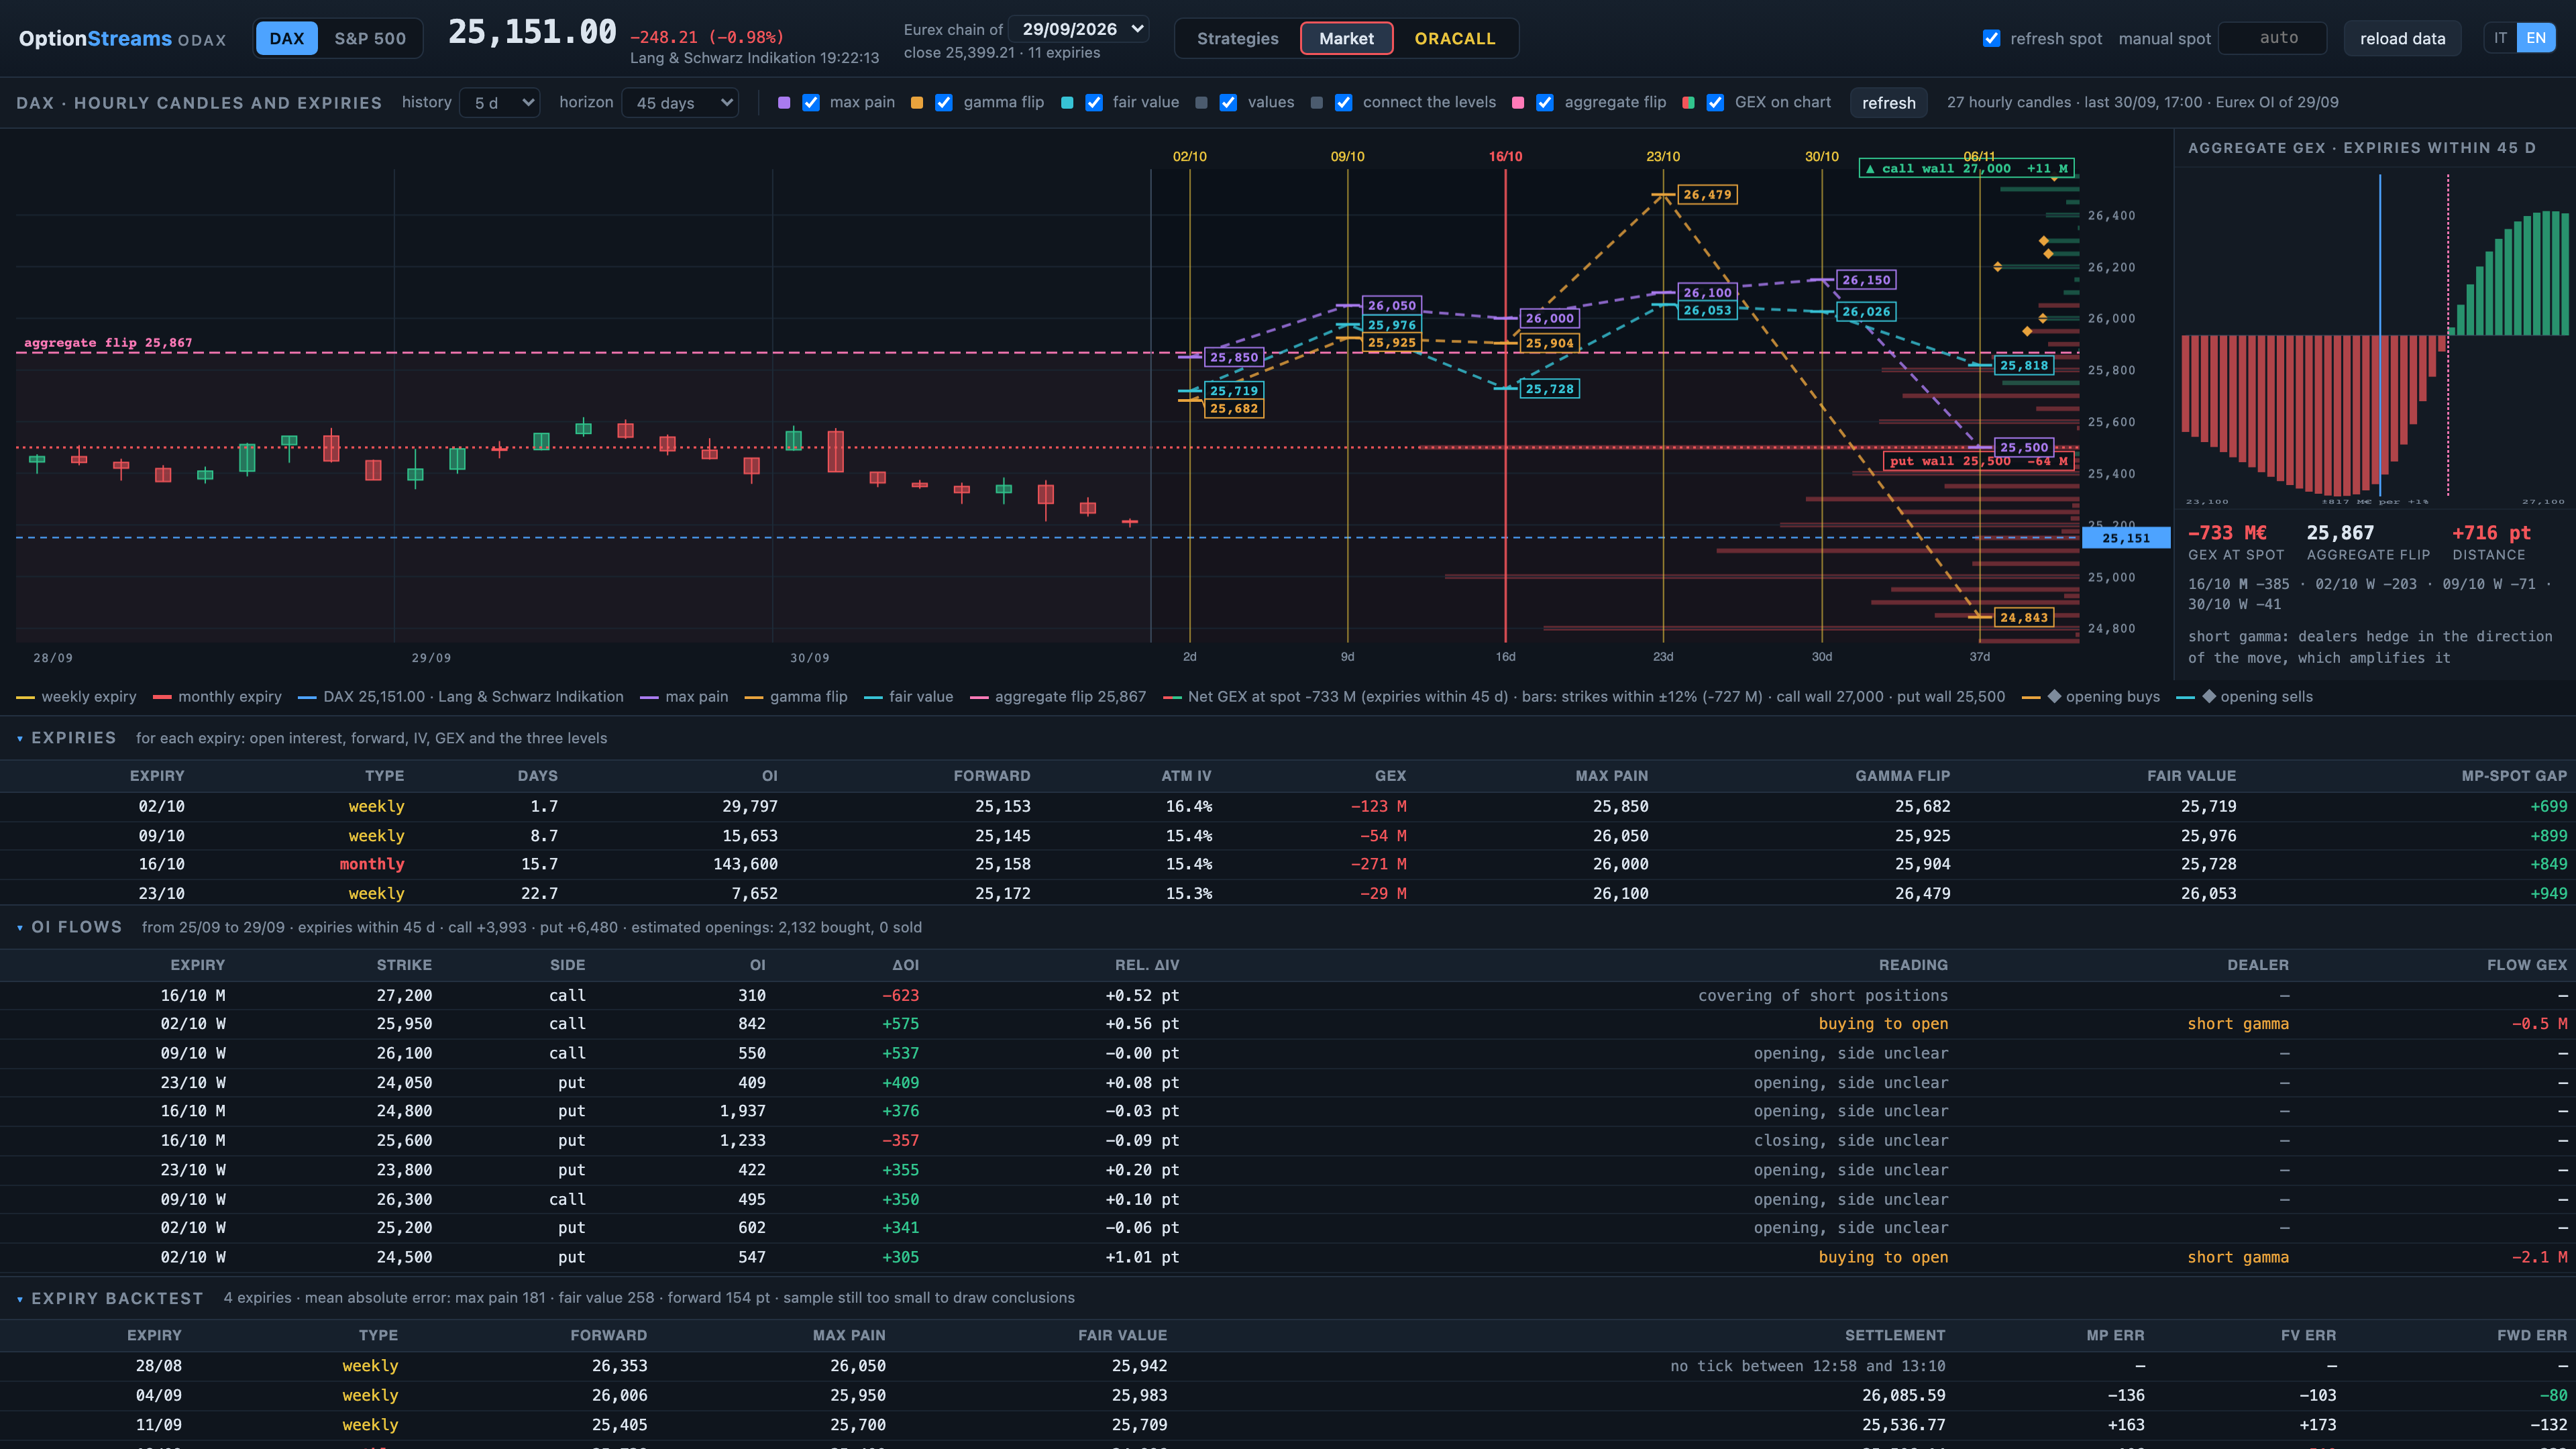
Every open expiry becomes a vertical on the index chart, with the three levels that matter marked at their price. The tables below give you the numbers; the chart gives you the shape.

The level where option sellers pay the least at expiry. Calculated across the whole chain, for every expiry, and drawn where it sits.
Where dealer gamma changes sign: above it moves are dampened, below it they are amplified. Per expiry and aggregated across the whole chain, with each expiry's contribution.
The crossing of the cumulative call and put curves, with the 40% and 80% levels: the zone where positioning is balanced and the zone where it is not.
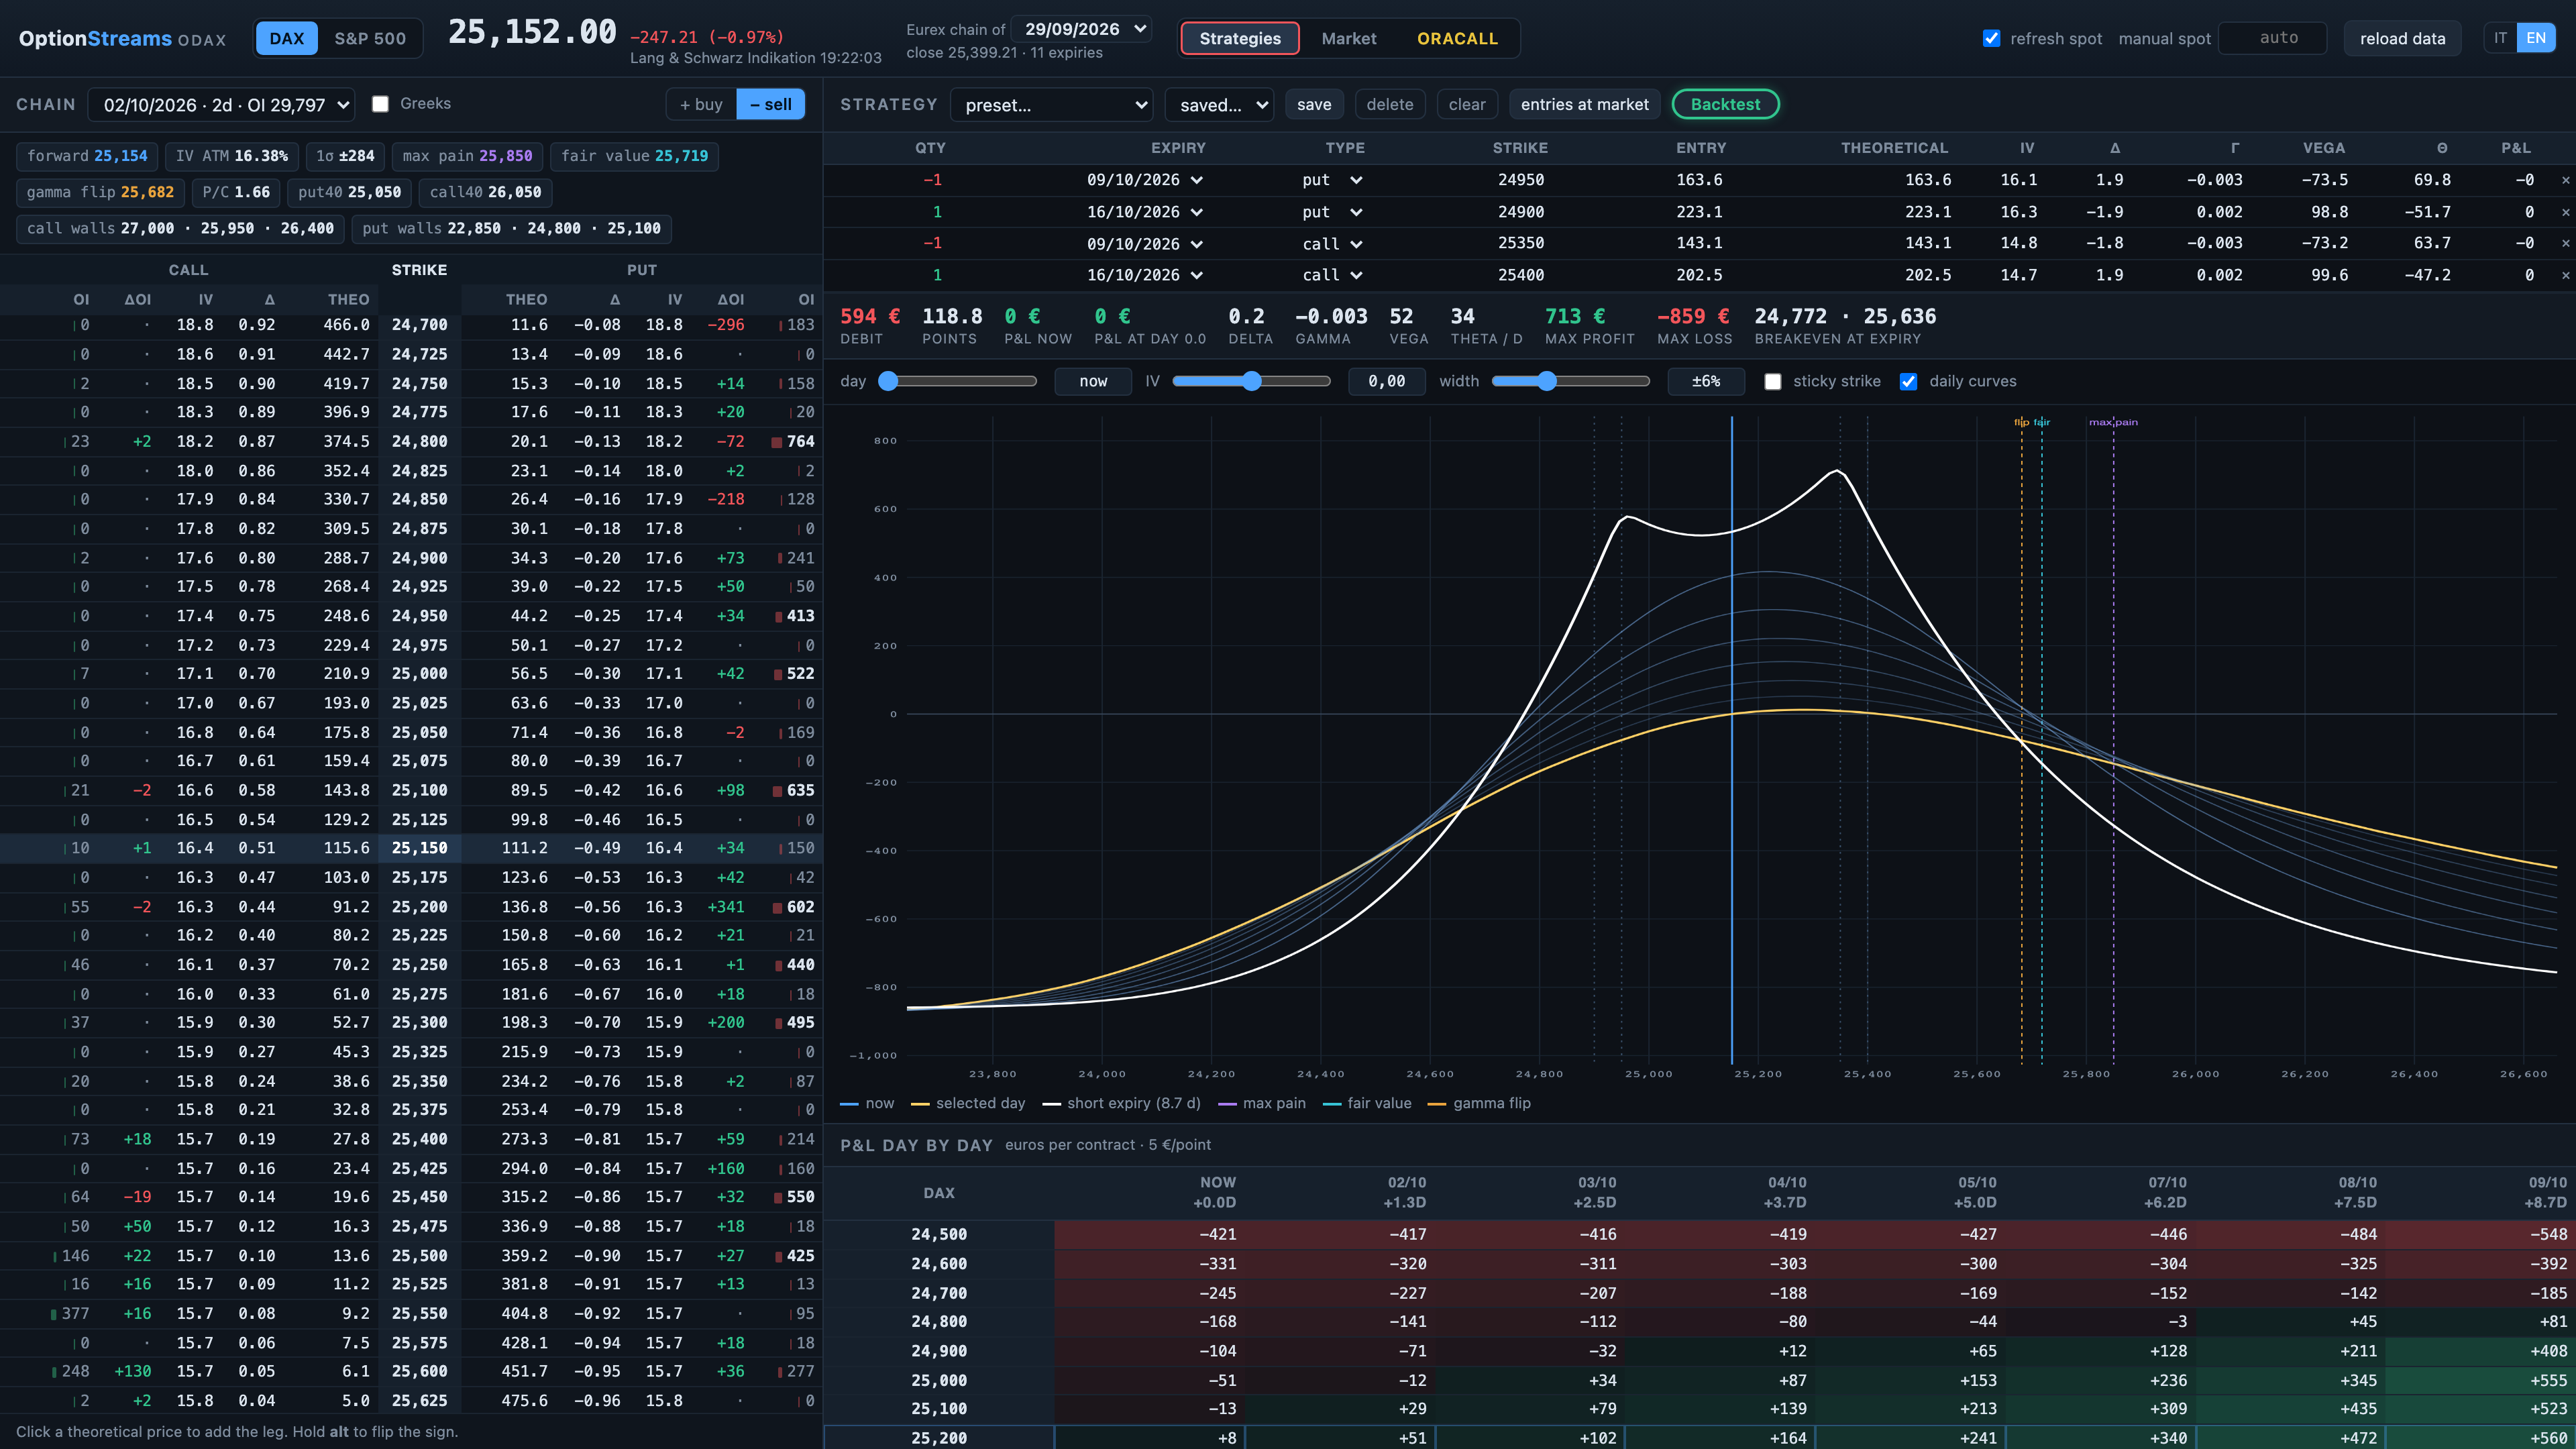
Open interest, daily change, volumes, IV by strike, delta, gamma, vega and theta. On both sides, for every expiry.
The expiry's call and put walls, the money chart levels and the aggregate flip, all on the chart. Switch on and off whatever you want to see.
DAX (ODAX, Eurex) and S&P 500 (SPX, CBOE) with their own conventions: multiplier, settlement times, daily expiries. Switch index and everything changes.
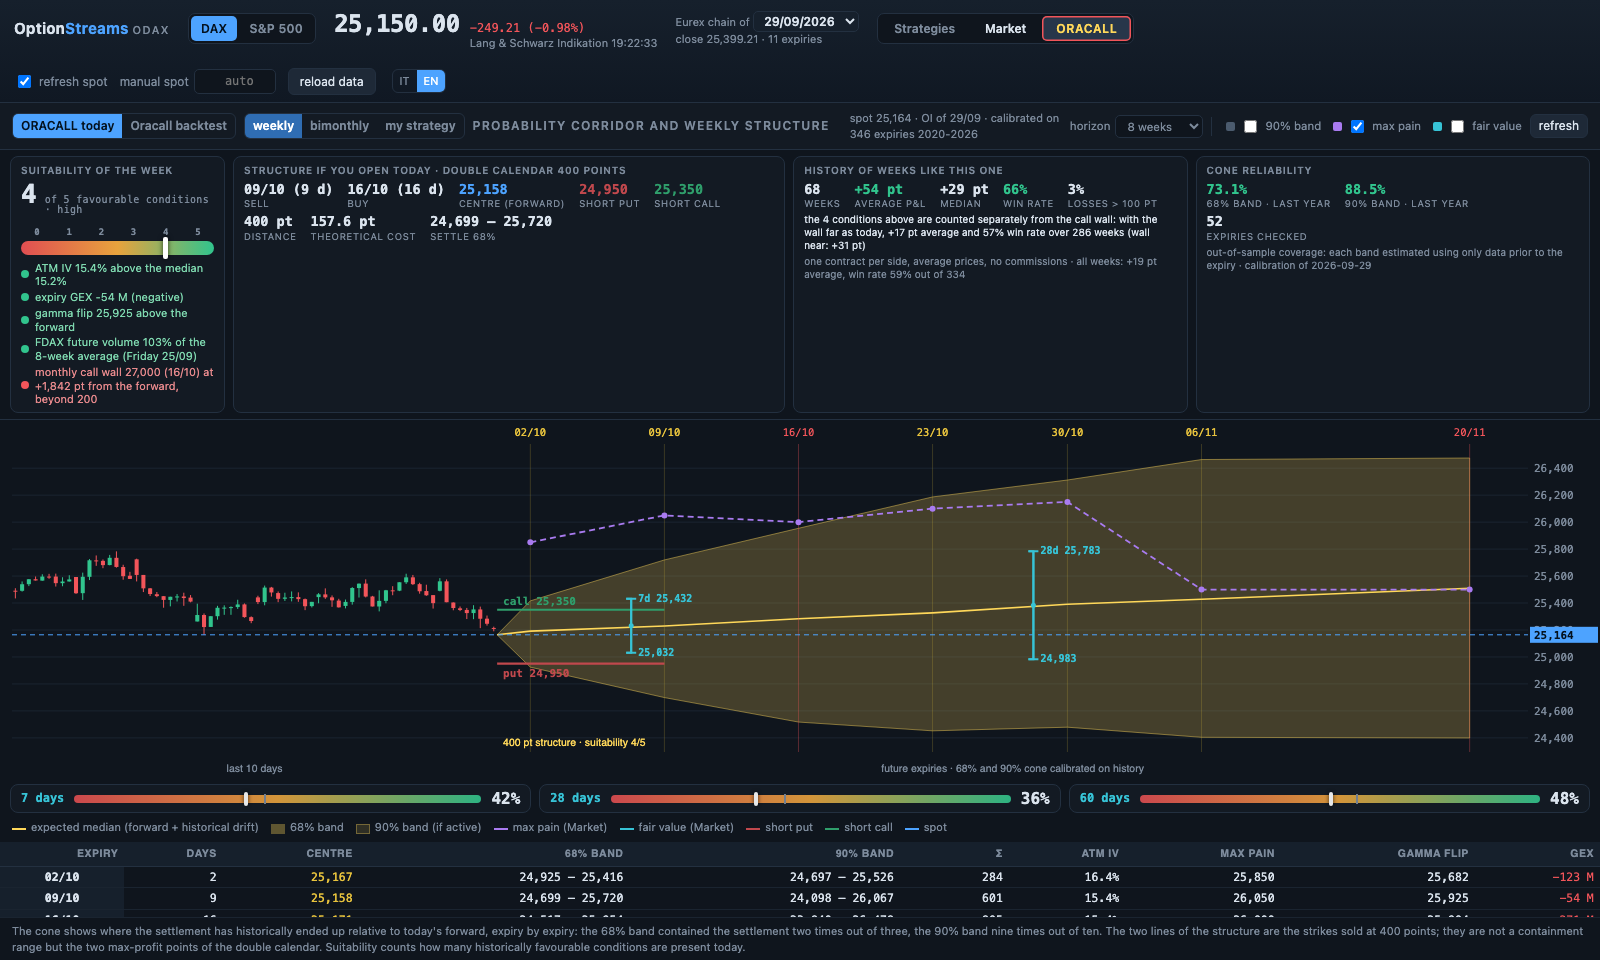
A probability cone calibrated on six years of settlements and a gauge that counts how many historically favourable conditions are present today. Statistics, not opinion.
Build any structure and see how it would have performed since 2020 at real prices, trade by trade, and under which market conditions it paid off. Find out how.
Click a strike in the chain and the leg goes in. Or start from a preset — calendar, double calendar, condor, butterfly, vertical — and adjust. The profile redraws with every click.


A DAX archive since 2020, with the open interest, prices and settlements of every expiry, and on top a probability cone built on empirical quantiles, not on a theoretical bell curve. Five conditions measured at entry separate the good weeks from the bad ones: you see them on a gauge, green or red.
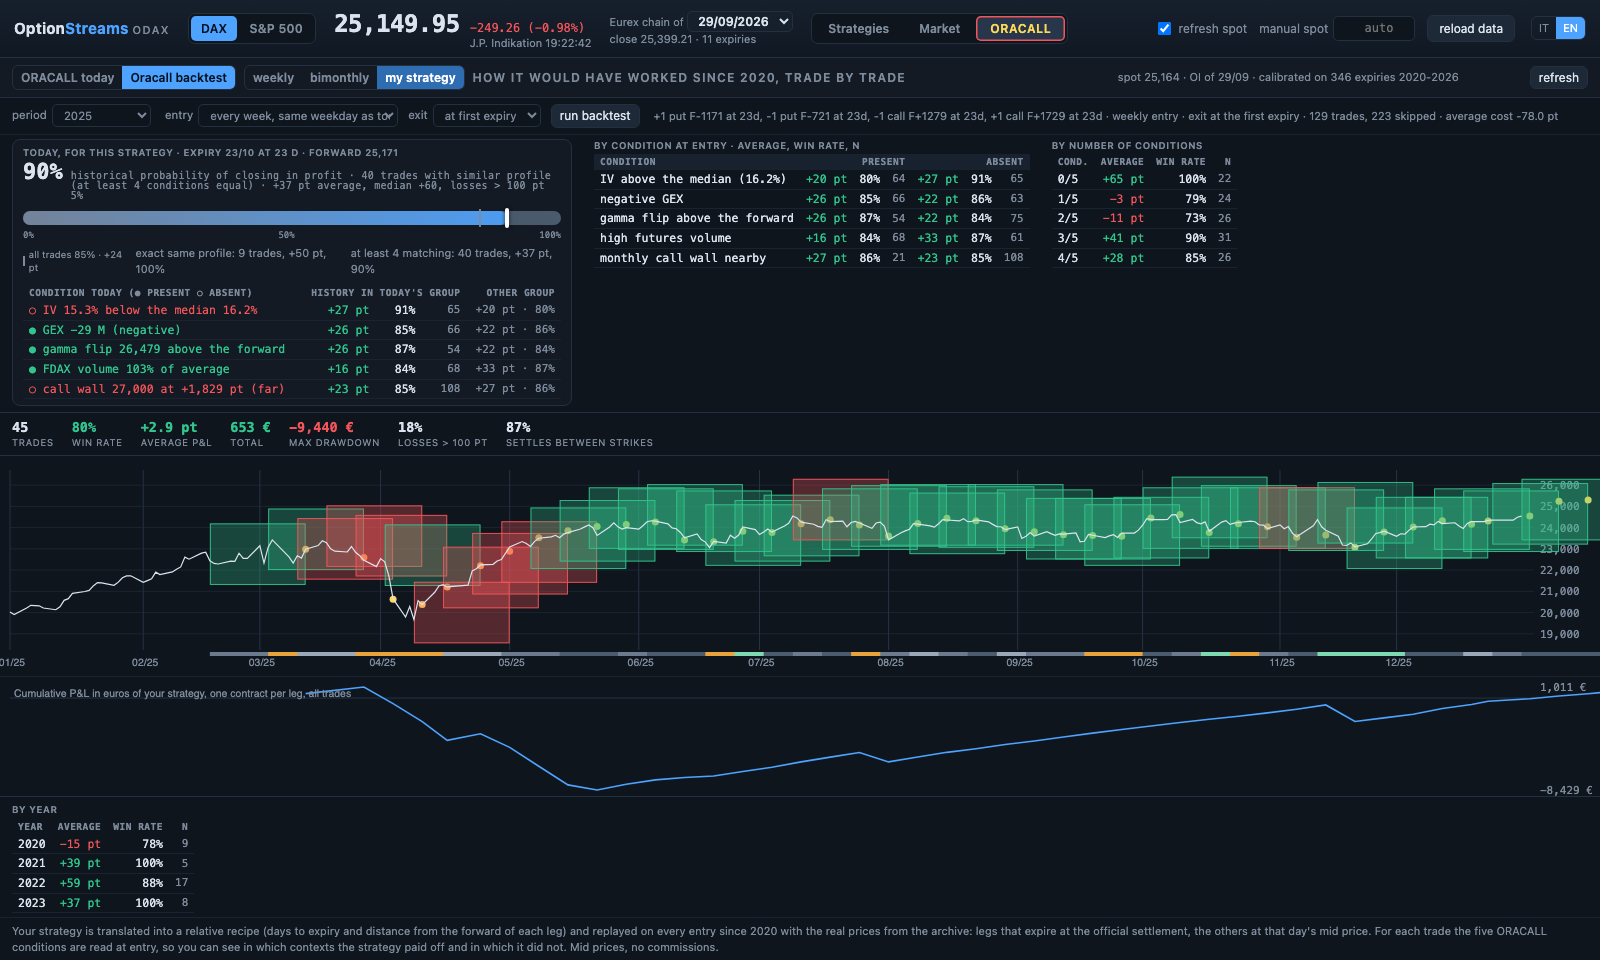
A three-week butterfly, a condor on the monthly, a calendar on the weeklies, the structure you have used for years: you build it in Strategies as usual, press a button and OptionStreams replays it on every entry since 2020 with the real prices from the Eurex archive. Not a theoretical simulation: the same expiries, the same distances from price, the real settlements, the official final settlement prices. In ten seconds you have hundreds of trades and you know under which conditions your idea paid off and under which it lost.
Click the strikes in the chain or start from a preset. Each leg becomes a recipe: days to expiry and distance from the forward.
Choose when to enter (every week on the same weekday as today, or every day) and when to exit (at settlement or after N days). Press "run backtest".
Trades, winners, average P&L, total, drawdown, by year; and the result for each of the five market conditions at entry.
The same engine reads the current conditions, IV, GEX, gamma flip, future volume, call wall, and compares them with the historical trades that had the same profile: how many there are, how many closed in profit, how much they returned on average. It is not advice, it is your strategy measured against its own past under today's conditions.
Real example, weekly 400-point double calendar replayed 340 times: 58% of trades in profit, +13 points on average, €22,081 in total, maximum drawdown −€4,138. With IV above the median +27 points on average, with IV below −1. Mid prices, no commissions: the past is not a forecast, but it is the only place where an idea can be measured before paying for it.

Each rectangle is a trade between its strikes: green if it closed in profit, red if at a loss, the yellow dot is the settlement. Above, the gauge with the historical probability under today's conditions.
One minute, no card. From your profile you start the free trial whenever you like: three days with everything included.
Mac, PC, tablet. Nothing to download, no updates to run: you are always on the latest version.
Every morning the chain is updated to the previous close. The index price and the candles move in real time.
We state exactly what is delayed and by how much, because for an analysis tool that is what matters most.
| What | DAX (ODAX) | S&P 500 (SPX) |
|---|---|---|
| Option chain | Official Eurex statistics: open interest, volumes and settlement prices of the previous close | CBOE chain delayed by 15 minutes: bid/ask, open interest, volumes |
| Index price | Real time (market indications) and Xetra | Real time (market indications) and S&P Indices |
| Candles | Hourly, from Xetra ticks | Hourly, from S&P Indices ticks |
| Option prices | Theoretical: chain smile re-anchored to the current index price (Black-76). You can enter the real prices from your platform for the legs you trade. | |
| Contracts | €5 per point, strikes every 50, settlement at the 13:00 fixing | $100 per point, strikes every 5, monthlies at the open and weeklies at the New York close |
Delayed data is included in the subscription at no extra cost. DAX, Eurex, Xetra, S&P 500 and CBOE are trademarks of their respective owners; OptionStreams is not affiliated with any of them.
Both indices, all features, updates included. Prices include VAT.
Create your account, sign in to your profile and start the 3-day free trial whenever you like. No card, no waiting, no email to write.
No, and it never will. It is a tool that shows how the market is positioned and how a strategy would behave under certain assumptions. The decisions, and the responsibility, remain yours. We do not provide advice or investment services.
The index price and the candles are. The option chains are not: the DAX chain is updated every night to the previous close, the S&P 500 chain is delayed by 15 minutes. We state this clearly on every screen. For a positioning analysis tool that is more than enough; to place orders, use your own platform.
No. OptionStreams does not connect to accounts, does not place orders and does not hold money or instruments. All you need is a browser.
They are theoretical: recalculated from the chain smile at the current index price. Before trading, always check the real bid and ask on your platform, and enter them in the app if you want the exact P&L of your legs.
Yes. Build the structure in Strategies, open ORACALL, "Oracall backtest" tab, "my strategy" mode, and press "run backtest": it is replayed on every entry since 2020 with the real prices from the DAX archive, and the "today, for this strategy" panel compares the current conditions with history. DAX only, because the historical archive with prices and settlements exists for the ODAX. The calculation details are in the manual.
No: subscriptions are non-refundable, which is why the free trial is complete and requires no card. You can cancel at any time and access stays active until the end of the paid period. If you are a consumer, the law still gives you 14 days to withdraw from the activation of the plan, paying only for the days used: the details are in the Terms.
Access stops on its own and you pay nothing, because you did not enter any card. If you want to continue, you activate the monthly or annual plan from your profile: payment is handled by Stripe and you can cancel at any time.
Yes. Payments are handled by an authorised seller who issues the receipt with your country's VAT and, on request, an invoice made out to your company.
On any modern browser: Mac, Windows, Linux, tablet. There is nothing to install and you are always on the latest version.
OptionStreams is not a financial service. It is an analysis and simulation tool that studies options markets for informational and educational purposes. We are not an intermediary, we are not authorised or supervised by CONSOB or any other authority, we do not provide investment advice, we do not receive orders, we do not manage assets and we do not hold clients' money or instruments.
Nothing the application shows — levels, statistics, simulations, risk profiles — constitutes a recommendation, an invitation to trade or a forecast. Calculations are based on models with simplified assumptions and on third-party data, delayed and provided without any guarantee of accuracy or continuity. Options are leveraged instruments: losses can be rapid and, for those who sell options, greater than the capital committed.
Every trading decision is solely yours. If you need guidance on your situation, consult a licensed financial adviser. Read the full notice.